S&P 500 (SPX): Just 5 %To 7% shy of critical 4150 which may initiate long-term Selling

Description
Created in 1957, the S&P 500 was the first US market cap-weighted stock market index. The index includes 500 leading companies and covers approximately 80% of available market capitalization. Today, it’s the basis of many listed and over-the-counter investment instruments.
Index Characteristics
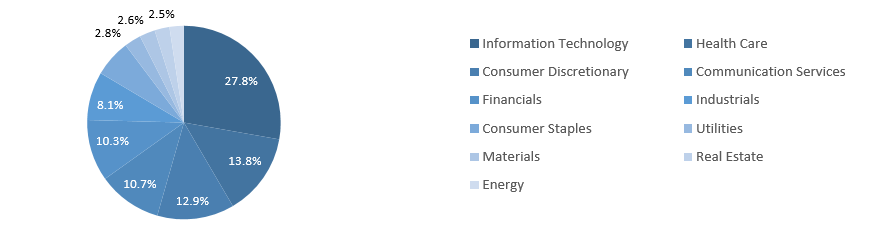
The index is a capitalization-weighted index and the 10 largest companies in the index account for 28.1% of the market capitalization of the index.
| Number of Constituents | 505 |
| Constituent Market cap (USD Mn) | |
| Mean Total Market Cap | 65,445 |
| Largest Total Market cap | 2,243,557 |
| Smallest Total Market Cap | 3,299 |
| Median Total Market Cap | 25,919 |
| Weight largest Constituent (%) 6.7 | 6.7 |
| Weight Top 10 Constituents (%) | 28.1 |
Sector Breakdown
IT sector companies constitute 27.8% of total market cap followed by consumer discretionary and financials companies. The 10 largest companies in the index, in order of weighting, are Apple Inc., Microsoft Corp., Amazon.com. Facebook Inc, Tesla Inc, Alphabet Inc (class A&C), Berkshire Hathaway, J&J, and JP Morgan Chase & Co.
Historical Trend
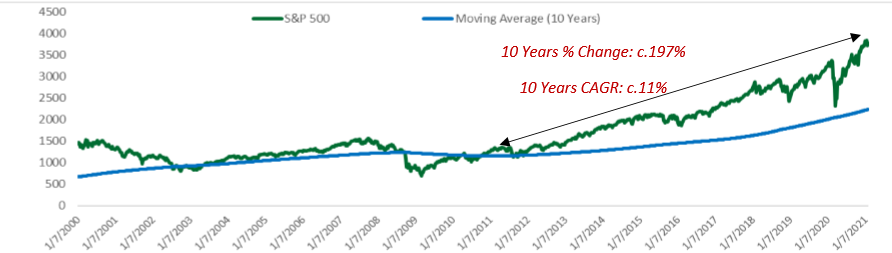
Statistical Analysis
Insights on S&P 500
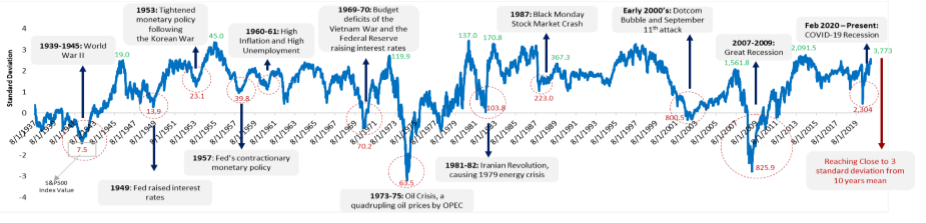
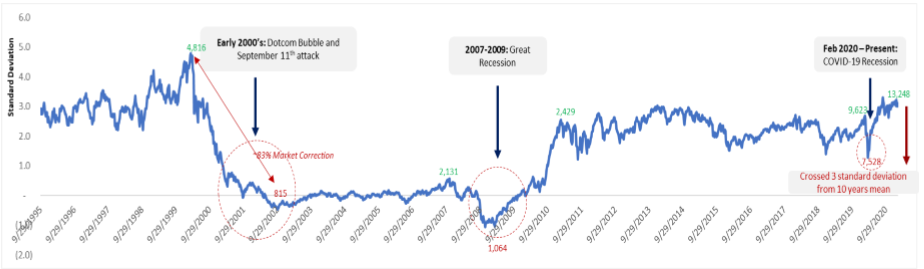
Based on quantitative analysis of last 100 years of S&P 500 data, we found that S&P 500 trades
- 66% of the time 1 SD (standard deviation) above its 10 years mean, 28% of time 2SD above its 10 years mean and only 2% of time 3SD above its 10 years mean.
- Historically SPX touches 3SD after a gap of 10-20 years and it normally results in 30% correction eventually in the next 2-3 years.
- Currently, S&P 500 is trading at around 3,850 which is just 7% shy of 3SD event at 4150. The last instances when the SPX crossed 3SD were in 1988 and 1987 and in both the events, it eventually resulted into 30% correction in the next 2 to 3 years.
- The current SPX set up is unforeseen in the last 20 years and hence not captured empirically by financial research houses.
We believe that SPX may move towards a maximum of 4150 however risk-reward is not much in favor and hence eventfully may correct to 3000 levels in the next 2-3 years.
Risk & Return
The index has highest annualized return of 18.6% in last 3 years with annualized risk of 11.0%.
| Annualized Risk | Annualized Return | |
|---|---|---|
| 3 Years | 18.6% | 11.0% |
| 5 Years | 15.0% | 15.5% |
| 10 Years | 13.5% | 12.8% |
Risk is defined as standard deviation calculated based on total returns using monthly values. All information as on January 30th, 2021.
NASDAQ: Showing similar patterns just before 2000 dotcom burst
Description
The Nasdaq Composite Index measures all Nasdaq domestic and international-based common stocks listed on the Nasdaq Stock Market. The index is a large market cap-weighted index of more than 2,500 stocks, ADRs, and real estate investment trusts. The composition of the Nasdaq composite is heavily weighted towards companies in the Information Technology Sector.
Sector Breakdown
As of December 30th, 2020, the industry weights of the Nasdaq composite Index’s individual securities are Technology at 48.1%, Consumer services at 19.5%, Health Care at 10.1%, Consumer Goods at 8%, Industrials at 5.9% and Financials at 5.4%.
Historical Trend
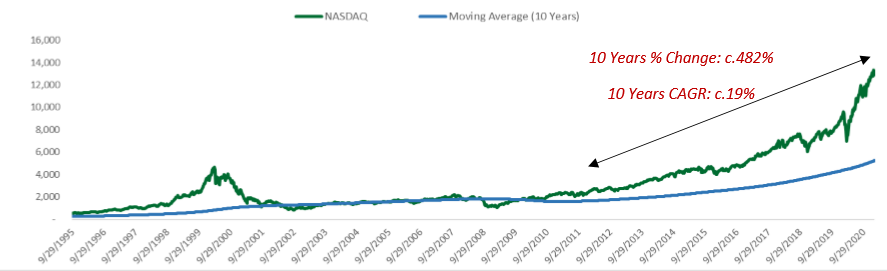
Statistical Analysis
Insights on Nasdaq
Based on quantitative analysis of the last 35 years Nasdaq data, we found that Nasdaq trades
- 62% of the time 1 SD (standard deviation) above its 10 years mean, 52% of time 2SD above its 10 years mean, 11% of time 3SD above its 10 years mean and only 1% of time 4SD above its 10 years mean.
- Currently, Nasdaq is trading around 13,500 and has crossed 3SD event at 13000 and is 15% shy from 4SD event which is at 15500. Nasdaq touched 4SD only once in its history just before 2000 dotcom crash which resulted into its losing resulted in 83% erosion of value. Nasdaq has crossed 3SD recently only after a gap of 20 years since 2000.
We believe that upside in Nasdaq is limited to maximum 10-15% from here while downside could be very high as it is moving into bubble zone not seen in the recent times.
DOW JONES INDUSTRIAL AVERAGE (DJIA): offers best risk-reward amongst the larger indices
Description
The Dow Jones Industrial Average is a price-weighted measure of 30 US blue chip companies. The index covers all industries except transportation and utilities.
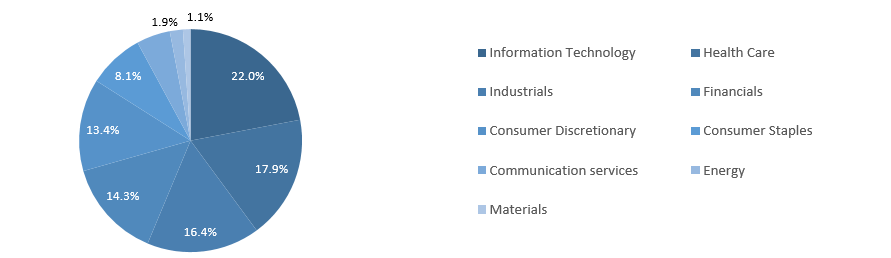
Sector Breakdown
IT sector constitute 22% of its weight followed by 17.9% for healthcare and 16.4% for industrial sectors.
Historical Trend
Statistical Analysis
Insights on DJIA
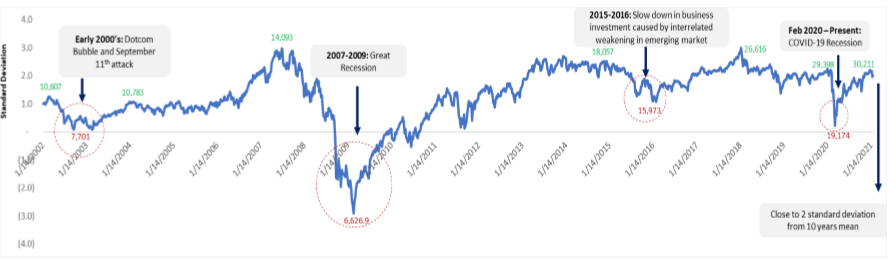
Based on quantitative analysis of last 30 years, we found that DJI trades
- 66% of time 1 SD (standard deviation) above its 10 years mean, 31% of time 2 SD above its 10 years mean and 0% of the time 3 SD above its 10 years mean.
- Currently, DJI has crossed 30,200 level which is 2 SD above its 10 years mean. Dow has historically been comfortable at 2SD and hence we expect Dow jones to move up further from these levels as 3SD event is 20% away from the current levels.
On comparing DJI index with other indexes, we believe that DJI can offer better risk-reward in the near future compared to NASDAQ, SPX and RUT.
Risk & Return
DJIA has highest annualized return in last 5 years with annualized risk of 15.5%
| Annualized Risk | Annualized Return | |
|---|---|---|
| 3 Years | 18.8% | 6.3% |
| 5 Years | 15.5% | 14.6% |
| 10 Years | 13.6% | 11.6% |
Risk is defined as standard deviation calculated based on total returns using monthly values. All information as on January 30th, 2021
RUSSELL 2000 (RUT): Has moved into unchartered territories
Description
The Russell 2000 Index measures the performance of the small-cap segment of the US equity universe. The Russell 2000 Index is a subset of the Russell 3000 Index representing approximately 10% of the total market capitalization of that index. As of January 31st , 2021, the weighted average market capitalization for a company in the index is around $3.8 billion, the median market cap is $922 million. The market cap of the largest company in the index is $28.65 billion.
Sector Breakdown
As of December 31st, 2020, the sector with the largest weight in the index is Health Care sector which accounts for 21.1% followed by Industrials and Financials, each account for 15.3%. The smallest contribution is by the energy sector.
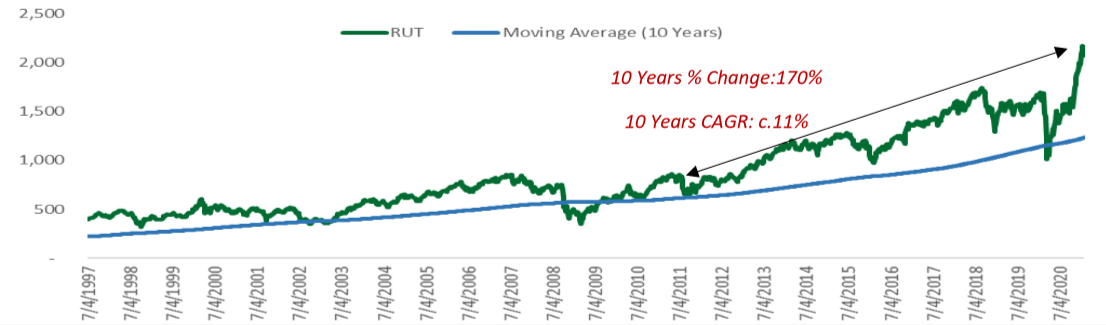
Historical Trend
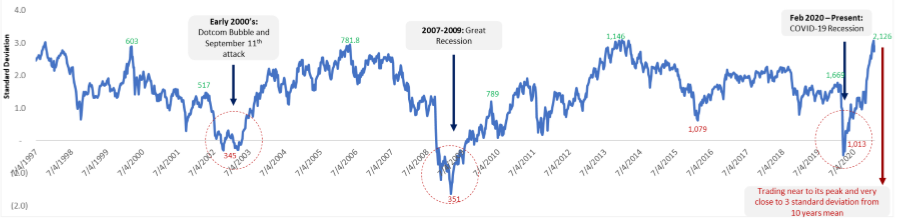
Statistical Analysis
Insights on RUT
Based on quantitative analysis of the last 33 years data, we found that RUT trades
- 79% of time 1 SD (standard deviation) above its 10 years mean, 32% of time 2 SD above its 10 years mean and only 1% of time 3 SD above its 10 years mean.
- Currently, RUT is trading at 2,150 and has crossed 3SD event. Prior to 2021, RUT crossed 3SD event only 2 times in the last 30 years, in 1997 and 2013-14. In both cases RUT fell by 30% in the next 2-3 years.
We believe that there is no major upside left in RUT and risk-reward is not at all in the favor of any long trades in RUT. We expect RUT to fall to 1500 levels in the next 2-3 years.
Risk & Return
Russell 2000 has highest annualized return of 16.5% in last 5 years with annualized risk of c.21%.
| Annualized Risk | Annualized Return | |
|---|---|---|
| 3 Years | 25.3% | 11.1% |
| 5 Years | 20.9% | 16.5% |
| 10 Years | 18.8% | 11.7% |
All information as on January 31st, 2021

Conclusion
- Russell 2000 is into unchartered territories and investors should be cautious.
- Amongst all the 4 indices, DJIA looks the best from risk-reward perspective for the next 3-5 years.
- SPX is just 5-7% shy of the critical 3 Std Deviation event which happened just before 2000 dotcom burst and 1987 Black Monday Crash.