We provide support to hedge funds by offering specialized services that enhance operational efficiency and strategic decision-making. These services include comprehensive risk analysis, market research, and financial modeling, enabling hedge funds to make informed investment decisions.
Investing into growth-oriented stocks selected from EM500 and using qualitative and quantitative parameters for constituent screening and constantly managing portfolio risk.
Read MoreConstructing a portfolio comprising of biotech and pharma companies based in the US and back testing the portfolio with different weights for portfolio optimization to maximize Sharpe ratio or Sortino ratio with less volatility.
Read MoreConducting market research on an emerging market from a risk-reward scenario, market size & depth, liquidity & trading volumes, instruments, trading costs & infrastructure and taxation & regulations
Read MoreTracking TMT sector and identifying key economic and market-driven factors that affect the revenue growth, operating cost, cost of capital etc. of portfolio companies and help them in updating the financial model with the latest market updates.
Read MoreAnalyzing the portfolio of stocks and identifying the attributes which impact the performance of a portfolio.
Read MoreLeveraging ML model to combine core fundamental analysis with state-of-the art quantitative techniques to predict the performance of a large number of stocks by comparing their relative performance.
Read MoreUsing DTCC data and leveraging JMI multilevel model to measure volatilities, risk and returns trends by combining trends of multiple levels of trade concentration for each stock.
Read MoreReducing model complexity and improving the efficiency of portfolio returns using dynamic optimization techniques.
Read MoreOptimizing the long short strategy parameters by using multi-variate regression and statistical modeling.
Read MoreDeveloping a detailed model to track and generate multiple real-time quant signals across the stock universe and back-tested with different values of the factors.
Read MoreUsing JMI AI/ML platform to develop a long short strategy used as a hedge during a volatile market.
Read MoreWe provide similar solutions in AWS, Google Cloud and Salesforce
Read MoreUS-based Asset Manager with 20+ years of experience and AUM of over USD2.5bn
Read MoreInvestment Bank looking for research support on initiating coverage of multiple companies
Read MorePortfolio manager looking to evaluate equity investment thesis
Read MoreTop 500 stocks from Emerging Market.
Portfolios are checked for historical outperformance to ensure that only consistently outperforming strategies are selected.
The team does in-depth quantitative research using statistical and fundamental parameters used for constituent screening and constantly manages portfolio risk using max drawdown, skew kurtosis and other volatility parameter.
The research team does individual stock picking after going through company reports and financials and decides on a host of qualitative and quantitative parameters to be considered while screening stocks for the respective strategy.
Following parameters are considered while assigning weights to stocks in this portfolio
This portfolio has a real-time rebalance schedule. On a daily basis, the research team reviews this portfolio and realign the weights with the selected asset allocation strategy.
Ratios | Portfolio(Growth Strategy) | EM500 |
---|---|---|
PE Ratio | 25.38 | 21.93 |
PB Ratio | 2.38 | 2.45 |
Dividend Yield(%) | 0.86 | 1.82 |
Sharpe Ratio | 1.7 | 0.7 |
Drawdown | 18% | 40% |
Our client, a US-based hedge fund, wanted us to construct a portfolio comprising of biotechnology and pharmaceutical companies based in the US with a market cap in the range of USD 500 Mn to 2 Bn and in clinical stage for COVID-19 Vaccine development.
Selected 100+ US-based Pharma and biotech Companies on key parameter.
Screened 30 companies based on key parameter like clinical stage, efficacy rate etc.
Conducted in-depth research on 30 companies and Selected 22 companies.
Back tested the portfolio with different weights to get optimal portfolio.
Tracked the Portfolio for a month
A mid-size US multi-manager hedge fund wanted market research on an emerging market from a risk-reward scenario, market size & depth, liquidity & trading volumes, instruments, trading costs & infrastructure, and taxation & regulations.
JMI was involved in conducting initial market research covering all these aspects. Key findings of the project are listed:-
Our Client, a US-based hedge fund, wanted us to track the Technology, Media and Telecom sector and identify key economic factors that affect the revenue growth, operating cost, cost of capital etc. of portfolio companies and help them in updating the financial model with latest market updates.
In-depth Study on Sector to identify key metrics
Tracked the market-driven factors like liquidity, momentum and fund flow
Conducted Fundamental Research on Portfolio Company
Keep track on latest financials and key parameter for each company
Updated the model with key parameters on daily basis
Our client, a US-based hedge fund, wanted us to analyze the portfolio of stocks and identify the attributes that impact the performance of a portfolio.
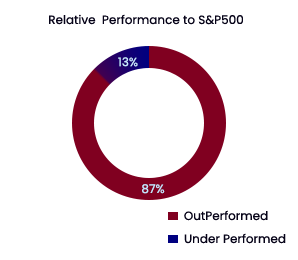
JMI team Identified that c.13% of portfolio, 13 stocks have shown negative momentum during different time periods over a long time
Our client, a US-based hedge fund, wanted us to rank a large number of stocks and bonds targeted for long-term investments and review the relative performance of the assets to manage risks better.
Collected 2,000+ stocks from client which they wanted to analyze
Inherited fundamental data of each stock such as financials, shareholding pattern, daily return etc.
Applied JMI unique ML model to predict relative performance of each stock
Investigated through different ML models using FNN, RF and ANFIS
Ranked the stocks and analyzed their relative performance
Our client, a US-based hedge fund, wanted us to analyze a large number of stocks using alternative data.
Collected 500+ stocks from client which they wanted to analyze
Extracted data from DTCC on trading volume in context of market activity
Measured key parameter like volatility, risk and return trends with trade volume
Compared Relative Performance trends of industry and sector for each stocks
Analyzed the pattern and provide insights
An investment fund developed a long short index trading strategy to generate additional alpha and reduce the draw down on overall fund performance. However, the actual realized results were significantly different from the back tested results leading to a sub-optimal performance of the fund.
Assessed the client’s quant strategy using in-house advanced quant platform and recorded following parameters:
Ran the Strategy on JMI’s proprietary quant platform, across multiple sections of in-sampled and out-sampled data and recorded strategy result dataset which showed varied performance across time frames.
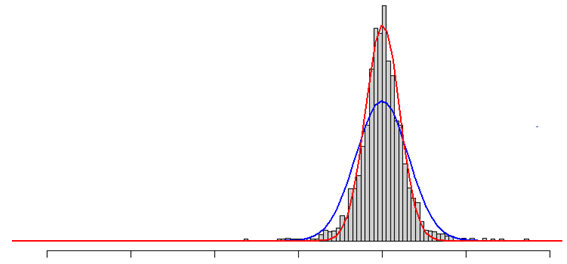
On further statistical analysis across time periods, JMI identified that the back tested result dataset was influenced by high kurtosis (+9.5) and negative skew (-1.7), and this led to high deviation in actual and back tested performance of the long short strategy.
Optimized the long short strategy parameters by using multi-variate regression and statistical modelling.
Added new volatility-based indicator to the strategy which led to a significant improvement in overall strategy and actual results in line with the back tested results.
Long Only Fund wanted to develop quant models for real-time tracking of 1000+ listed stocks and optimize entry/exit of portfolio companies.
Building a long short trading strategy that could work consistently in US stock markets and that can also be used as a hedge during volatile markets.
Created in 1957, the S&P 500 was the first US market cap-weighted stock market index. The index includes 500 leading companies and covers approximately 80% of available market capitalization. Today, it’s the basis of many listed and over-the-counter investment instruments.
The index is a capitalization-weighted index and the 10 largest companies in the index account for 28.1% of the market capitalization of the index.
Number of Constituents | 505 |
Constituent Market cap (USD Mn) | |
Mean Total Market Cap | 65,445 |
Largest Total Market cap | 2,243,557 |
Smallest Total Market Cap | 3,299 |
Median Total Market Cap | 25,919 |
Weight largest Constituent (%) 6.7 | 6.7 |
Weight Top 10 Constituents (%) | 28.1 |
IT sector companies constitute 27.8% of total market cap followed by consumer discretionary and financials companies. The 10 largest companies in the index, in order of weighting, are Apple Inc., Microsoft Corp., Amazon.com. Facebook Inc, Tesla Inc, Alphabet Inc (class A&C), Berkshire Hathaway, J&J, and JP Morgan Chase & Co.
Based on quantitative analysis of last 100 years of S&P 500 data, we found that S&P 500 trades
We believe that SPX may move towards a maximum of 4150 however risk-reward is not much in favor and hence eventfully may correct to 3000 levels in the next 2-3 years.
The index has highest annualized return of 18.6% in last 3 years with annualized risk of 11.0%.
Annualized Risk | Annualized Return | |
---|---|---|
3 Years | 18.6% | 11.0% |
5 Years | 15.0% | 15.5% |
10 Years | 13.5% | 12.8% |
Risk is defined as standard deviation calculated based on total returns using monthly values. All information as on January 30th, 2021.
The Nasdaq Composite Index measures all Nasdaq domestic and international-based common stocks listed on the Nasdaq Stock Market. The index is a large market cap-weighted index of more than 2,500 stocks, ADRs, and real estate investment trusts. The composition of the Nasdaq composite is heavily weighted towards companies in the Information Technology Sector.
As of December 30th, 2020, the industry weights of the Nasdaq composite Index’s individual securities are Technology at 48.1%, Consumer services at 19.5%, Health Care at 10.1%, Consumer Goods at 8%, Industrials at 5.9% and Financials at 5.4%.
Based on quantitative analysis of the last 35 years Nasdaq data, we found that Nasdaq trades
We believe that upside in Nasdaq is limited to maximum 10-15% from here while downside could be very high as it is moving into bubble zone not seen in the recent times.
The Dow Jones Industrial Average is a price-weighted measure of 30 US blue chip companies. The index covers all industries except transportation and utilities.
IT sector constitute 22% of its weight followed by 17.9% for healthcare and 16.4% for industrial sectors.
Based on quantitative analysis of last 30 years, we found that DJI trades
On comparing DJI index with other indexes, we believe that DJI can offer better risk-reward in the near future compared to NASDAQ, SPX and RUT.
DJIA has highest annualized return in last 5 years with annualized risk of 15.5%
Annualized Risk | Annualized Return | |
---|---|---|
3 Years | 18.8% | 6.3% |
5 Years | 15.5% | 14.6% |
10 Years | 13.6% | 11.6% |
Risk is defined as standard deviation calculated based on total returns using monthly values. All information as on January 30th, 2021
The Russell 2000 Index measures the performance of the small-cap segment of the US equity universe. The Russell 2000 Index is a subset of the Russell 3000 Index representing approximately 10% of the total market capitalization of that index. As of January 31st , 2021, the weighted average market capitalization for a company in the index is around $3.8 billion, the median market cap is $922 million. The market cap of the largest company in the index is $28.65 billion.
As of December 31st, 2020, the sector with the largest weight in the index is Health Care sector which accounts for 21.1% followed by Industrials and Financials, each account for 15.3%. The smallest contribution is by the energy sector.
Based on quantitative analysis of the last 33 years data, we found that RUT trades
We believe that there is no major upside left in RUT and risk-reward is not at all in the favor of any long trades in RUT. We expect RUT to fall to 1500 levels in the next 2-3 years.
Russell 2000 has highest annualized return of 16.5% in last 5 years with annualized risk of c.21%.
Annualized Risk | Annualized Return | |
---|---|---|
3 Years | 25.3% | 11.1% |
5 Years | 20.9% | 16.5% |
10 Years | 18.8% | 11.7% |
All information as on January 31st, 2021
The client was very pleased with the final product, particularly around the much lower cost and ease of administration. Additional iterations of the platform are already being seamlessly deployed, with the underlying infrastructure able to handle any amount of additional data or load from end users.
A US-based Asset Manager with 20+ years of experience and AUM of over USD2.5bn in the global capital markets reached out to JMI for equity research and valuation model support across multiple sectors.
A Portfolio Manager at a US$5bn event driven fund needed help evaluating a potential special situations investment opportunity. He believed that a leading player in the global manufacturing space was being undervalued (by potentially as much as 50%), as a stand-alone entity when compared to the sum of its parts. JMI was engaged to perform a viability study of the client hypothesis, identify mile markers likely to catalyze a valuation re-rating and develop qualitative and quantitative metrics as well as sensitivities around up/down side scenarios.