Across Global offices with Corporate HQ in New York City
20+ years of track record
In US, Europe and Asia including Fortune 500
Globally across multiple sectors
We are working with investment banking firms to help improve productivity, reduce costs, and become more agile. Supporting them with CIMs, transaction research, financial modeling & valuations, due diligence, and building pitch decks.
Learn MoreOur comprehensive suite of value-added services spans the entire private capital markets spectrum, encompassing deal origination, thorough evaluation, and diligent portfolio monitoring, all of which empower investment professionals to stay at the forefront of the industry.
Learn MoreWe provide support to hedge funds by offering specialized services that enhance operational efficiency and strategic decision-making. These services include comprehensive risk analysis, market research, and financial modeling, enabling hedge funds to make informed investment decisions.
Learn MoreJMI play a pivotal role in supporting venture capital firms by offering specialized services such as market research, deal sourcing, financial modeling, due diligence, valuation, and portfolio monitoring. Our expertise enables VCs to make informed investment decisions, identify promising opportunities, and optimize the performance of their portfolios.
Learn MoreOur comprehensive suite of value-added services by leveraging expertise in credit analysis, risk management, and strategic investment to fuel growth and maximize returns to empower your financial endeavours.
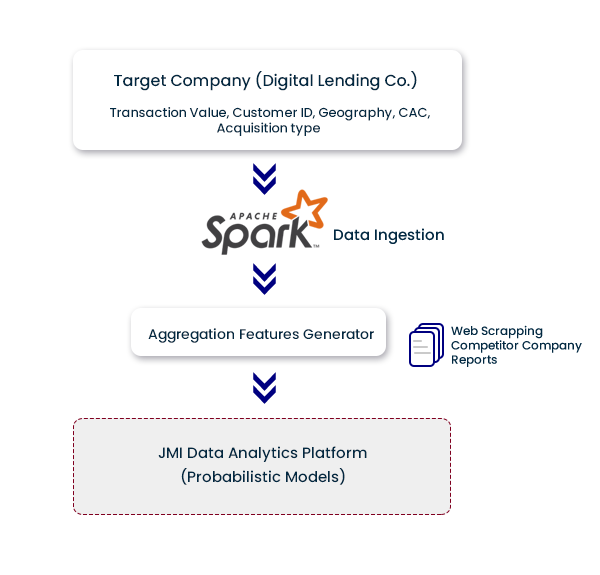
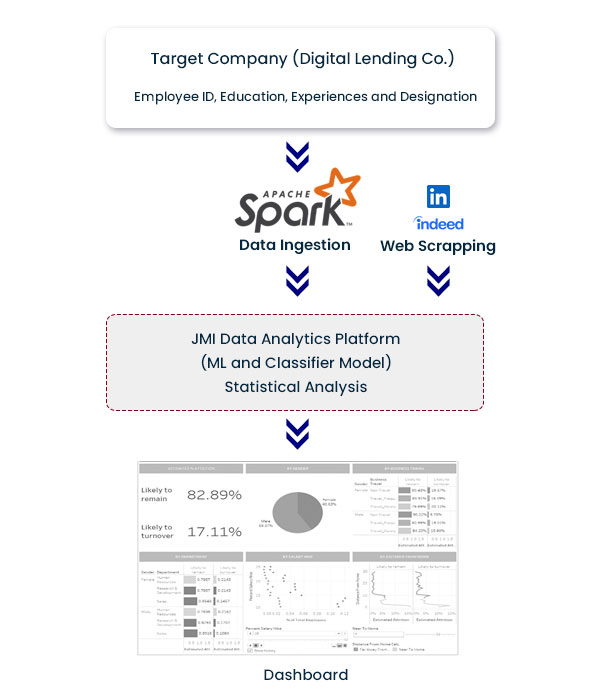
Learn MoreWe help firms navigate in today's world of complex data. JMI provides custom-made solutions by leveraging our AI, ML, NLP, and Visualization Expertise.
Learn MoreJMI supports real estate funds by offering end-to-end services. These include identifying lucrative investment opportunities through extensive deal sourcing, conducting thorough due diligence to assess risk and potential returns, and managing portfolios for optimal performance. Additionally, we provide expertise in market research and analysis, aiding funds in making informed decisions in the dynamic real estate landscape.
Learn MoreWe specialize in tailored financial solutions designed specifically for family offices, supporting the preservation and growth of generational wealth. Our expertise spans administrative services, asset management, corporate finance, and regulatory compliance, catering to the diverse needs of family offices.
Learn MorePreparing a quarterly model with separate financial statements for each of the...
Tracking TMT sector and identifying key economic and market-driven factors that affect...
Preparing a comprehensive database of all mid and large corporates across the sectors...
Combine Alternative data into financial modeling to provide a clearer picture...
Chief Executive Officer,SQN Capital
Founder, Juliane Advisors
Chief Financial Officer, Modiv Inc.
A United-States based Real Estate Fund wanted to raise money for acquisition of one property.
JMI’s solution comprised of the following three-phased approach:
Created in 1957, the S&P 500 was the first US market cap-weighted stock market index. The index includes 500 leading companies and covers approximately 80% of available market capitalization. Today, it’s the basis of many listed and over-the-counter investment instruments.
The index is a capitalization-weighted index and the 10 largest companies in the index account for 28.1% of the market capitalization of the index.
Number of Constituents | 505 |
Constituent Market cap (USD Mn) | |
Mean Total Market Cap | 65,445 |
Largest Total Market cap | 2,243,557 |
Smallest Total Market Cap | 3,299 |
Median Total Market Cap | 25,919 |
Weight largest Constituent (%) 6.7 | 6.7 |
Weight Top 10 Constituents (%) | 28.1 |
IT sector companies constitute 27.8% of total market cap followed by consumer discretionary and financials companies. The 10 largest companies in the index, in order of weighting, are Apple Inc., Microsoft Corp., Amazon.com. Facebook Inc, Tesla Inc, Alphabet Inc (class A&C), Berkshire Hathaway, J&J, and JP Morgan Chase & Co.
Based on quantitative analysis of last 100 years of S&P 500 data, we found that S&P 500 trades
We believe that SPX may move towards a maximum of 4150 however risk-reward is not much in favor and hence eventfully may correct to 3000 levels in the next 2-3 years.
The index has highest annualized return of 18.6% in last 3 years with annualized risk of 11.0%.
Annualized Risk | Annualized Return | |
---|---|---|
3 Years | 18.6% | 11.0% |
5 Years | 15.0% | 15.5% |
10 Years | 13.5% | 12.8% |
Risk is defined as standard deviation calculated based on total returns using monthly values. All information as on January 30th, 2021
The Nasdaq Composite Index measures all Nasdaq domestic and international-based common stocks listed on the Nasdaq Stock Market. The index is a large market cap-weighted index of more than 2,500 stocks, ADRs, and real estate investment trusts. The composition of the Nasdaq composite is heavily weighted towards companies in the Information Technology Sector.
As of December 30th, 2020, the industry weights of the Nasdaq composite Index’s individual securities are Technology at 48.1%, Consumer services at 19.5%, Health Care at 10.1%, Consumer Goods at 8%, Industrials at 5.9% and Financials at 5.4%.
Based on quantitative analysis of the last 35 years Nasdaq data, we found that Nasdaq trades.
We believe that upside in Nasdaq is limited to maximum 10-15% from here while downside could be very high as it is moving into bubble zone not seen in the recent times.
The Dow Jones Industrial Average is a price-weighted measure of 30 US blue chip companies. The index covers all industries except transportation and utilities.
IT sector constitute 22% of its weight followed by 17.9% for healthcare and 16.4% for industrial sectors.
Based on quantitative analysis of last 30 years, we found that DJI trades
On comparing DJI index with other indexes, we believe that DJI can offer better risk-reward in the near future compared to NASDAQ, SPX and RUT.
DJIA has highest annualized return in last 5 years with annualized risk of 15.5%
Annualized Risk | Annualized Return | |
---|---|---|
3 Years | 18.8% | 6.3% |
5 Years | 15.5% | 14.6% |
10 Years | 13.6% | 11.6% |
Risk is defined as standard deviation calculated based on total returns using monthly values. All information as on January 30th, 2021.
The Russell 2000 Index measures the performance of the small-cap segment of the US equity universe. The Russell 2000 Index is a subset of the Russell 3000 Index representing approximately 10% of the total market capitalization of that index. As of January 31st , 2021, the weighted average market capitalization for a company in the index is around $3.8 billion, the median market cap is $922 million. The market cap of the largest company in the index is $28.65 billion.
As of December 31st, 2020, the sector with the largest weight in the index is Health Care sector which accounts for 21.1% followed by Industrials and Financials, each account for 15.3%. The smallest contribution is by the energy sector.
Based on quantitative analysis of the last 33 years data, we found that RUT trades
We believe that there is no major upside left in RUT and risk-reward is not at all in the favor of any long trades in RUT. We expect RUT to fall to 1500 levels in the next 2-3 years.
Russell 2000 has highest annualized return of 16.5% in last 5 years with annualized risk of c.21%.
Annualized Risk | Annualized Return | |
---|---|---|
3 Years | 25.3% | 11.1% |
5 Years | 20.9% | 16.5% |
10 Years | 18.8% | 11.7% |
All information as on January 31st, 2021
Our Client, a US-based hedge fund, wanted us to track the Technology, Media and Telecom sector and identify key economic factors that affect the revenue growth, operating cost, cost of capital etc. of portfolio companies and help them in updating the financial model with latest market updates.
In-depth Study on Sector to identify key metrics
Tracked the market-driven factors like liquidity, momentum and fund flow
Conducted Fundamental Research on Portfolio Company
Keep track on latest financials and key parameter for each company
Updated the model with key parameters on daily basis
JMI worked closely with senior team members in creating an entry strategy for European Markets.
A mid-market private equity fund wanted to invest in a US-based digital lending fintech company. Historically, the PE fund relied upon traditional, manual, and defensive methods of due diligence. The fund wanted to get deeper data-driven due diligence insights on the company’s products, market positioning, customer beliefs, and organizational culture. JMI's data analytics team was roped in to leverage the JMI data analytics platform to get actionable insights on four broad areas, which included:
JMI's proprietary models and data aggregation platform produced unique and powerful insights on business revenue and margin performances based on raw transaction-level data along with core business capabilities and market drivers such as production capacity, sales and distribution KPIs, cash flow, and potential trends in the competitive market, etc.
The JMI data analytics platform set up during diligence for investment evaluation was further extended to capture the company’s everyday business intelligence in order to retain the key insights and data sources that underpinned the deal thesis and value creation plan over the investment cycle.
The PE fund wanted to understand the customers’ perceptions of the various company products and their competitive positioning in the market. They specifically wanted to leverage the JMI data analytics platform to gain deeper insights into customer views for various products using social networking websites and understand product positioning relative to competitors.
JMI analyzed the cost of customer acquisition across different marketing channels of the fintech company and provided specific insights on
The client wanted to understand the potential contributions made by a customer to company’s revenue across the years to estimate the customer lifetime value and gain deeper insights on customer mix which could contribute to higher revenues in the future.
The PE fund was facing difficulties in getting insights into the organization’s culture. They wanted to get a clear picture on employee beliefs towards the target company and predict employee attrition rate. They further wanted to analyze the correlation between attrition rate vs employee experience, salary and education background, etc.